6ixsenses — one dashboard for every channel
We built a private analytics dashboard for digital agency 6ixsenses so their retail client's management team has one URL that answers a single question: are we on track for our growth target? Store, ads, email and on-site search data flow in on a nightly schedule and roll up into one composite score.
Reporting spread across six tools, in one place
6ixsenses manages the marketing stack for a retailer whose data lived in six separate platforms — analytics, paid search, on-site search, email, and the store itself. Pulling a weekly picture meant logging into each one. The brief was a single, private dashboard that gathers all of it automatically, presents it in plain English for a non-technical management team, and treats customer privacy as a hard requirement rather than an afterthought.
Five sources, synced on a schedule
Scheduled jobs pull from each platform's API, normalise the results and upsert them into one Postgres database — historical data is never overwritten. Every run records what it did, so the admin panel can show the last sync time and record counts per source.
GA4
Sessions, channels, funnels and geography — 7 reports, synced nightly.
Google Ads
Campaign spend, clicks, conversions and ROAS, synced nightly.
Klevu
On-site search terms, zero-result queries and search geography, weekly.
Klaviyo
Per-campaign email revenue, open and click rates, synced nightly.
BigCommerce
Orders and line items via a guided CSV import that maps columns automatically.
The composite growth-index score combines five weighted inputs: revenue against the year-over-year target, blended paid ROAS, email revenue share, on-site search trend and conversion rate.
Screens from the dashboard
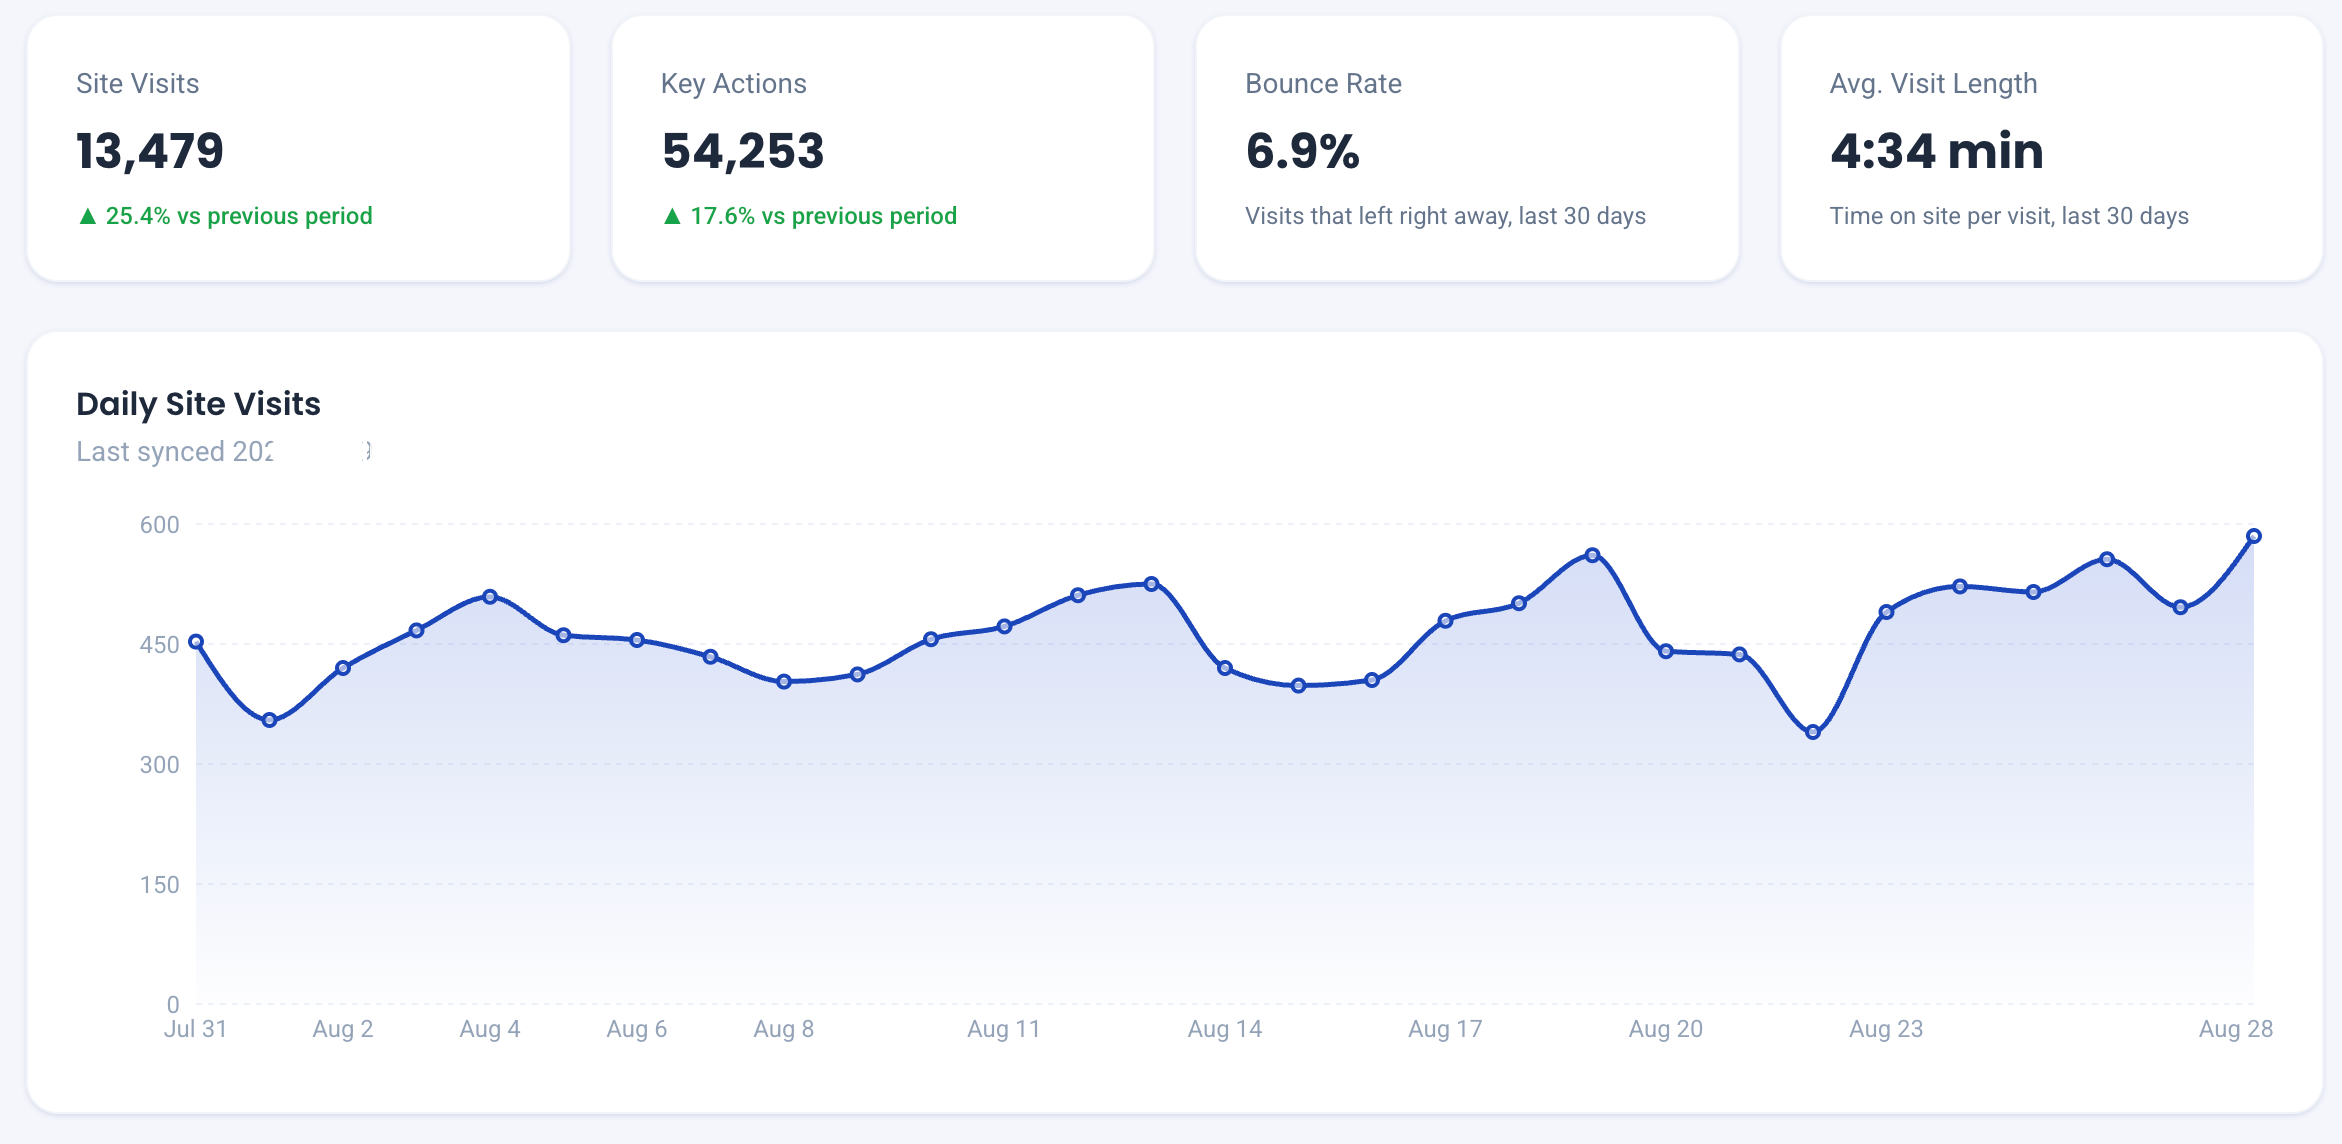
Overview — traffic and engagement at a glance
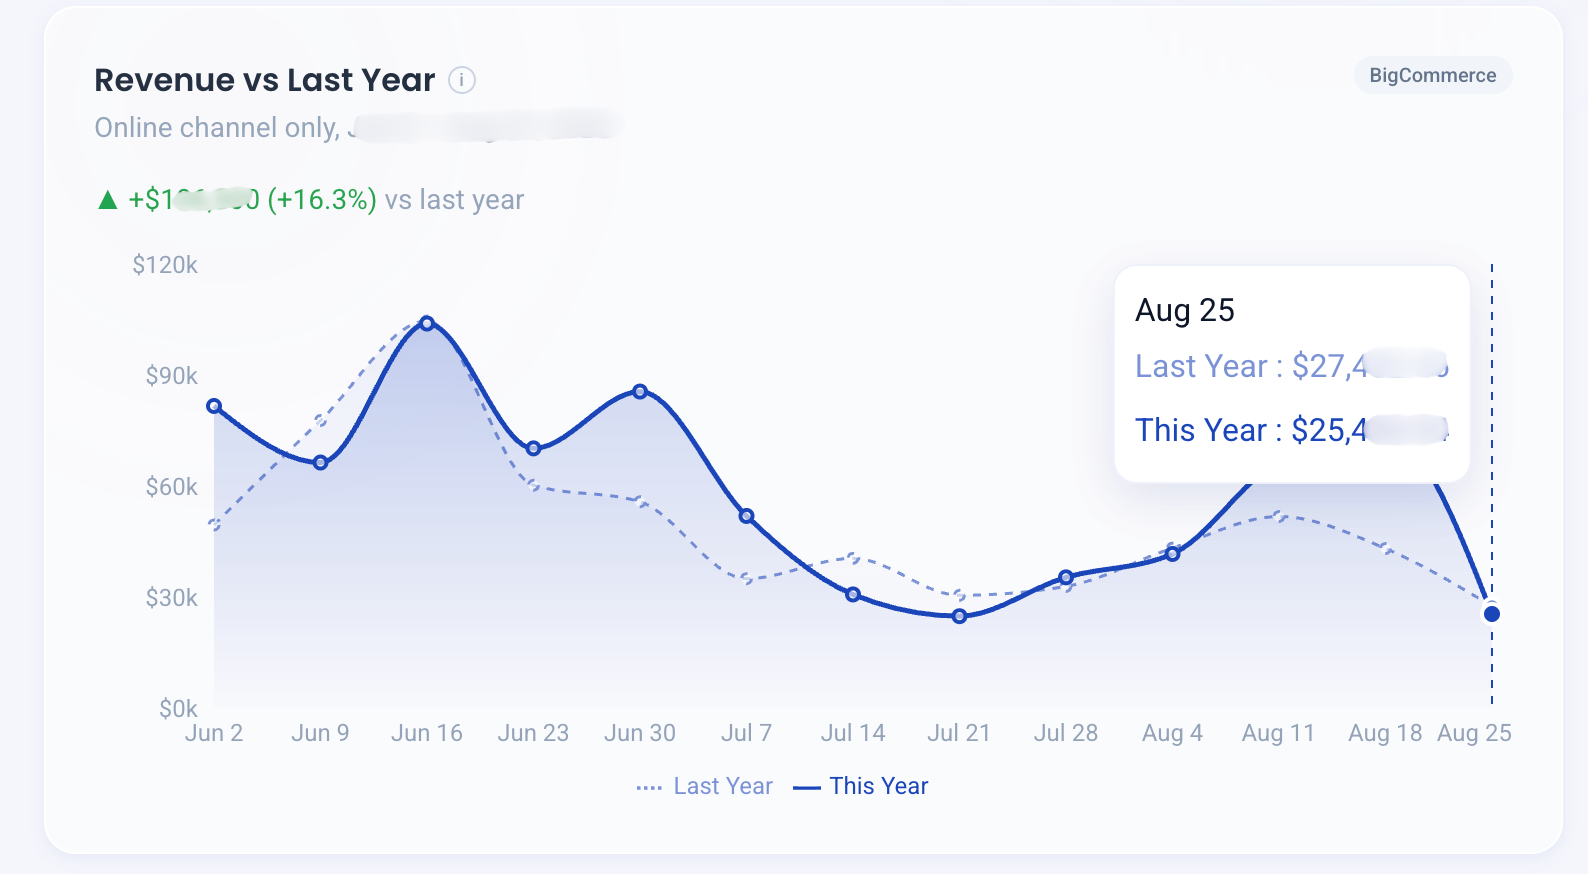
Revenue vs last year
The pages
Overview
Revenue, orders and average order value for a selectable period with year-over-year comparison, a six-month trend chart, and the composite growth-index score.
Channels
Website traffic by source and channel from GA4, plus Google Ads and Klaviyo email performance, in collapsible sections.
Geo
Where site visitors are located, by region and city, from GA4 session geography.
Products
Top-selling products and a category-by-month revenue heatmap, built from imported order line items.
Search
Klevu search analytics — top terms, zero-result searches with suggested fixes, and where searches come from.
Admin panel
Connector setup with test buttons, Smart Import for CSV uploads, sync-health monitoring, and user management.
Built to hold analytics value, not personal data
The dashboard handles real order and campaign data, so the privacy rules were fixed before the first sync was written and every feature has to follow them.
PII stripped at the door
Customer names, phone numbers and street addresses are never stored — there is no database column for them. Emails are reduced to their domain plus a consumer/institutional label; identity is kept only as a one-way keyed hash.
Database closed to the public
Row-level security is on for every table with no access policies, so the database cannot be queried directly over the internet. The application server is the only way in.
Encrypted connector credentials
API keys entered in the admin panel are encrypted with AES-256-GCM before storage and never sent back to the browser — the panel only shows whether a credential is saved.
Aggregate-only reporting
Every analytics connection requests campaign-level aggregates only. The app never calls an endpoint that would return an individual customer’s browsing or purchase history.
A small, boring stack
It is a Next.js app on Vercel with a Postgres database and Prisma for every query. Auth is a short-lived signed token with central role checks, bcrypt password hashing and IP-based brute-force lockout. Charts are Recharts. Scheduled syncs run as Vercel cron jobs, each guarded by a secret only the scheduler knows.
Every external API call has a hard timeout and a capped retry, so a slow or flaky upstream platform produces a skipped sync with a clear error rather than a hung dashboard — and those error messages are scrubbed of any email or phone pattern before they are stored.
The 6ixsenses dashboard, in short
Codifyany built a private, multi-source e-commerce analytics dashboard for digital agency 6ixsenses. It gives their retail client’s management team one URL that answers whether they are on track for their growth target. Data from GA4, Google Ads, Klevu, Klaviyo and BigCommerce flows in on a nightly schedule and rolls up into a single composite growth-index score.
Five sources: GA4 (sessions, channels, funnels and geography — 7 reports synced nightly), Google Ads (campaign spend, clicks, conversions and ROAS, nightly), Klevu (on-site search terms and zero-result queries, weekly), Klaviyo (per-campaign email revenue, open and click rates, nightly), and BigCommerce (orders and line items via a guided CSV import that maps columns automatically). Scheduled jobs normalise each API response and upsert it into one Postgres database — historical data is never overwritten.
Privacy was a hard requirement fixed before the first sync was written. PII — names, phone numbers, street addresses — is stripped at ingest; there is no database column for it. Emails are reduced to domain plus a consumer/institutional label, and identity is kept only as a one-way keyed hash. API credentials are AES-256-GCM encrypted before storage and never sent back to the browser. Row-level security is on for every table with no access policies, and every analytics connection requests campaign-level aggregates only.
It is a Next.js app on Vercel with a Postgres database and Prisma for every query. Auth uses a short-lived signed token with central role checks, bcrypt password hashing and IP-based brute-force lockout. Charts are Recharts. Scheduled syncs run as Vercel cron jobs, each guarded by a secret only the scheduler knows, and every external API call has a hard timeout and a capped retry.
One view of the data that's currently scattered.
Book a free 30-minute call. Tell us which tools your reporting lives in today, and we will tell you honestly what it takes to bring them together.